


")


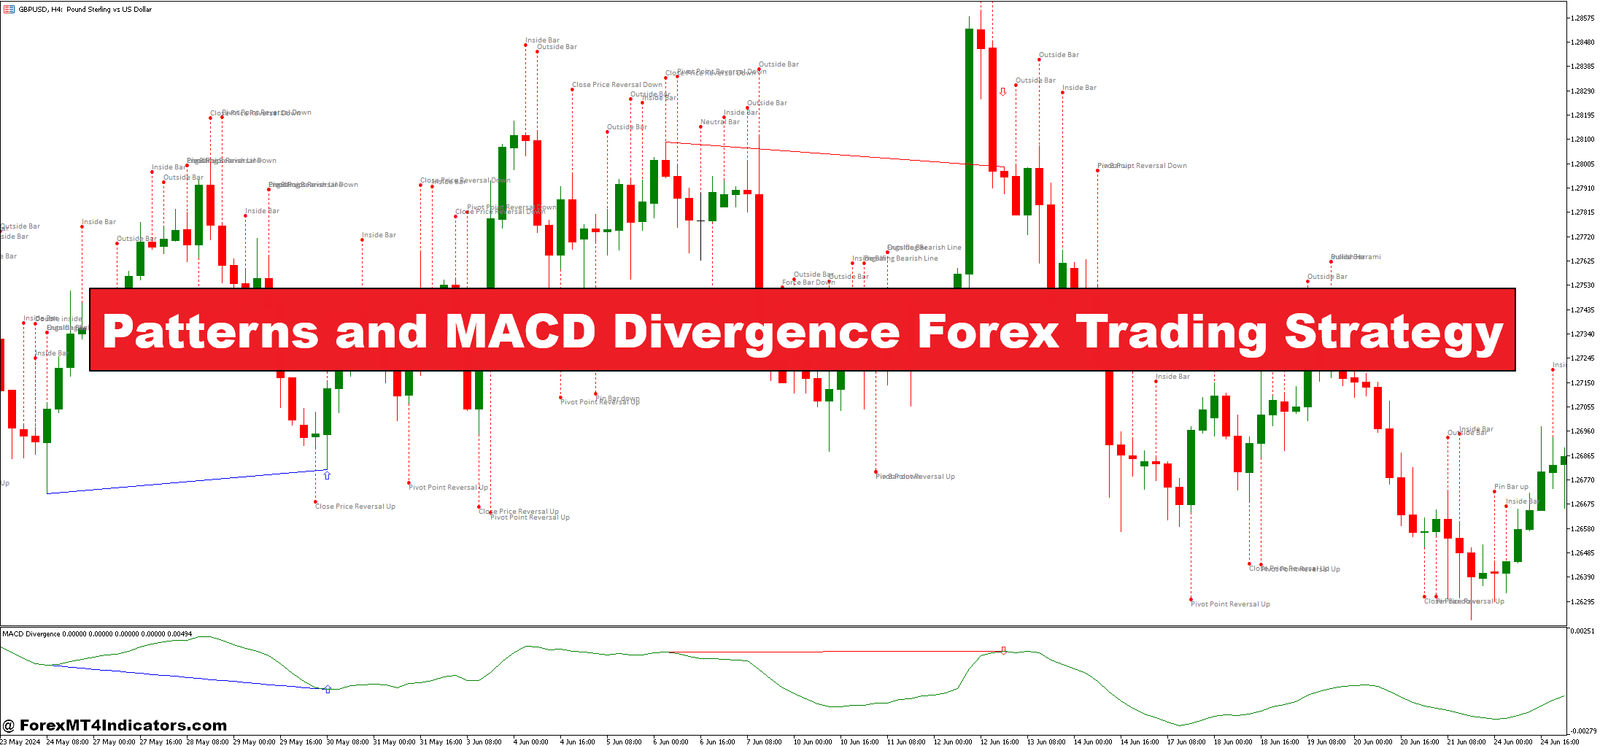

Patterns and MACD Divergence Forex Trading Strategy is a powerful combination that can significantly enhance a trader’s ability to identify profitable opportunities in the Forex market. This strategy leverages two essential aspects of technical analysis: price patterns and the MACD (Moving Average Convergence Divergence) indicator. By merging these elements, traders can gain deeper insights into potential market reversals, trend continuations, and price movements. The combination of visual chart patterns and MACD divergence offers a comprehensive approach to spotting high-probability setups that maximize trading success.
The strategy works by using price patterns—such as double tops, triangles, and head and shoulders—to identify key levels of support, resistance, and trend reversal zones. These patterns signal shifts in market sentiment, often indicating that a change in direction is imminent. At the same time, MACD Divergence comes into play by highlighting discrepancies between price movement and momentum. When a divergence occurs, it indicates a potential weakening or strengthening of the prevailing trend, providing a strong confirmation signal for traders to act upon.
What makes the Patterns and MACD Divergence Forex Trading Strategy particularly effective is its ability to blend both price action and momentum indicators into a cohesive trading method. By recognizing a pattern on the chart and confirming it with MACD divergence, traders can pinpoint entries and exits with more precision. Whether you’re trading on shorter timeframes or longer-term trends, this strategy offers a versatile and reliable approach to navigating the complex world of Forex trading.
Patterns Indicator
The Patterns Indicator is a key tool in technical analysis that helps traders identify specific formations on price charts. These formations, known as price patterns, serve as visual signals that reflect the psychology of market participants. Patterns can be broadly categorized into continuation and reversal patterns, both of which provide valuable insights into potential price movements.
Continuation patterns, such as flags, pennants, and triangles, suggest that the prevailing trend is likely to continue once the pattern completes. These patterns indicate periods of consolidation, where the market pauses before resuming its previous direction. On the other hand, reversal patterns, like double tops, head and shoulders, and double bottoms, signal a change in the direction of the market trend. The Patterns Indicator helps traders spot these formations early, providing them with an opportunity to enter the market at key levels, either ahead of a breakout or a trend reversal. By recognizing these patterns, traders can position themselves for higher-probability trades, making this indicator a cornerstone of any effective trading strategy.
One of the major advantages of using the Patterns Indicator is its simplicity. Traders can visually interpret these patterns without needing to rely on complex calculations, making it accessible even for beginners. When combined with other indicators, such as the MACD, the reliability of price patterns increases, providing traders with more confidence in their trading decisions. Recognizing these patterns in real-time allows for precise entries, better risk management, and higher potential for profits.
MACD Divergence Indicator

The MACD Divergence Indicator is a dynamic tool that helps traders assess the relationship between an asset’s price movement and its momentum, providing valuable insights into the strength or weakness of a trend. The MACD (Moving Average Convergence Divergence) is a momentum oscillator that calculates the difference between a short-term and long-term exponential moving average (EMA), usually the 12-period and 26-period EMAs. The indicator is then displayed as a histogram, showing the difference between these two moving averages, along with a signal line (typically the 9-period EMA of the MACD) to identify potential buy and sell signals.
Divergence occurs when the price of an asset moves in the opposite direction to the MACD. There are two types of divergence: bullish divergence and bearish divergence. A bullish divergence happens when the price forms lower lows, but the MACD forms higher lows, suggesting that the selling pressure is weakening, and a potential upward reversal is imminent. Conversely, bearish divergence occurs when the price forms higher highs, but the MACD forms lower highs, indicating that the buying momentum is fading and a potential downward reversal may be on the horizon. Divergence provides early warnings of trend exhaustion, allowing traders to take proactive positions before the market reverses.
The power of the MACD Divergence Indicator lies in its ability to confirm price action. When a divergence aligns with a price pattern—such as a head and shoulders pattern or a double top—it adds additional weight to the potential trade, increasing the probability of success. MACD divergence is not only useful for spotting trend reversals but also for gauging the strength of an ongoing trend. By using this indicator in combination with price patterns, traders can gain a deeper understanding of market conditions and make more informed trading decisions.
How to Trade with Patterns and MACD Divergence Forex Trading Strategy
Buy Entry

- Look for reversal patterns such as double bottoms, inverse head and shoulders, or ascending triangles.
- Ensure the pattern is well-formed with clear support and resistance levels.
- Check for bullish divergence: price forms lower lows, while the MACD forms higher lows.
- This indicates that momentum is shifting to the upside, even though price is still in a downtrend.
- Wait for a breakout above the resistance or neckline of the pattern (e.g., breakout above the neckline in a double bottom or inverse head and shoulders).
- MACD Line Crossover: Ensure the MACD line crosses above the signal line to confirm upward momentum.
- Stop Loss: Place it just below the recent swing low or the support level of the pattern.
- Take Profit: Target the pattern’s projected price movement, e.g., distance from the bottom of the pattern to the neckline for a double bottom.
Sell Entry

- Look for reversal patterns such as double tops, head and shoulders, or descending triangles.
- Confirm the pattern is clearly defined with clear resistance and support levels.
- Look for bearish divergence: price forms higher highs, while the MACD forms lower highs.
- This signals that the upward momentum is weakening, even though price is still in an uptrend.
- Wait for a breakdown below the support or neckline of the pattern (e.g., breakdown below the neckline in a double top or head and shoulders).
- MACD Line Crossover: Ensure the MACD line crosses below the signal line to confirm downward momentum.
- Stop Loss: Place it just above the recent swing high or the resistance level of the pattern.
- Take Profit: Target the pattern’s projected price movement, e.g., distance from the top of the pattern to the neckline for a head and shoulders.
Conclusion
The Patterns and MACD Divergence Forex Trading Strategy combines the best of price action and momentum analysis to provide traders with high-probability setups. By identifying clear price patterns and confirming them with MACD divergence, traders can make more informed and confident trading decisions. With proper risk management, this strategy can be a valuable tool in any trader’s toolbox, allowing them to capitalize on potential market reversals and trend continuations with greater accuracy and precision.
Recommended MT4 Broker
XM Broker
- Free $50 To Start Trading Instantly! (Withdraw-able Profit)
- Deposit Bonus up to $5,000
- Unlimited Loyalty Program
- Award Winning Forex Broker
- Additional Exclusive Bonuses Throughout The Year
- Exclusive 50% Cash Rebates for all Trades!


Already an XM client but missing out on cashback? Open New Real Account and Enter this Partner Code: 𝟕𝐖𝟑𝐉𝐐
Click here below to download:
Save
Save


")