


Fundamental
Overview
The bearish momentum waned
recently as the price reached the key support zone around the 72.00 handle. We’ve
got some spikes here and there caused by the Trump’s tariffs headlines with the
most recent one coming from the tariffs imposed on Canada, Mexico and China over
the weekend.
Thankfully, it seems like
Trump continues to use tariffs as a way to bring countries to the table and get
some resolutions on his demands. In fact, after some positive talks yesterday, the
tariffs on Mexico and Canada have been paused for 30 days which triggered some
risk-on sentiment in the markets.
Today, Trump is expected to
speak with Xi with China this morning already threatening a retaliation coming
into effect on February 10. Crude oil has reacted negatively to the positive
news on the Canadian and Mexican tariffs which is kind of a headscratcher since
positive news for global growth should be bullish for the market. Time will
tell.
Crude Oil
Technical Analysis – Daily Timeframe
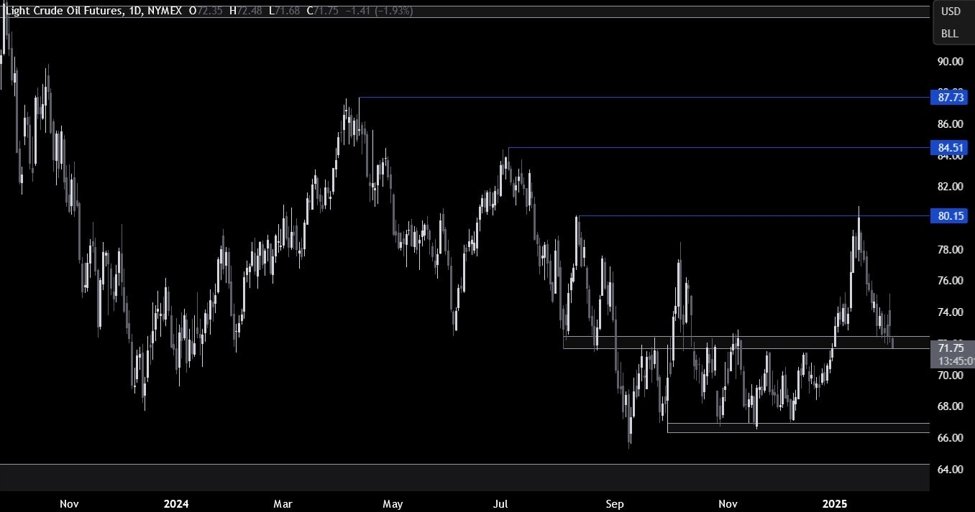
Crude Oil Daily
On the daily chart, we can
see that crude oil is now testing the key 72.00 support zone. This is where we can expect the buyers
to step in with a defined risk below the zone to position for a rally back into
the 80.00 handle. The sellers, on the other hand, will want to see the price
breaking lower to increase the bearish bets into the 67.00 handle next.
Crude Oil Technical
Analysis – 4 hour Timeframe
Crude Oil 4 hour
On the 4 hour chart, we can
see that the price became very choppy near the support zone as the bearish
momentum waned. If we get a bounce here, the next key level will be the 75.00
handle as a break above it should open the door for a rally into the 80.00
handle next. The sellers, on the other hand, will likely step in around the
75.00 level to position for a break below the 72.00 support with a better risk
to reward setup.
Crude Oil Technical
Analysis – 1 hour Timeframe
Crude Oil 1 hour
On the 1 hour chart, there’s
not much else we can add here as the buyers will look for a bounce around these
levels, while the sellers will look for a break lower to target new lows. The
red lines define the average daily range for today.
Upcoming
Catalysts
Today we get the US Job Openings data and
potentially a Trump-Xi call on tariffs. Tomorrow, we have the US ADP and the US
ISM Services PMI. On Thursday, we get the latest US Jobless Claims figures. On
Friday, we conclude the week with the US NFP report.


