


")

 Elliott Wave technical analysis [Video]")


Salesforce Inc., (SMCI) Daily Chart
Function: Counter Trend.
Mode: Corrective.
Structure: Zigzag.
Position: Wave C of (B).
Direction: Upside in wave C.
Details: We are looking at a pullback higher after a sharp decline in what could be wave (A) that lasted from March until November of 2024. Looking for one more leg higher into wave C of (B).
SMCI Elliott Wave technical analysis – Daily chart
Super Micro Computer Inc. (SMCI) appears to be in a corrective zigzag pattern, currently unfolding within wave C of (B). After a sharp decline in wave (A) from March to November 2024, the stock has been retracing higher, forming a corrective structure. Wave B seems to have completed, and now wave C is developing with potential short-term upside. Traders should watch key resistance levels and Fibonacci retracement zones, as the price action may attempt to break above recent highs before resuming a broader correction.
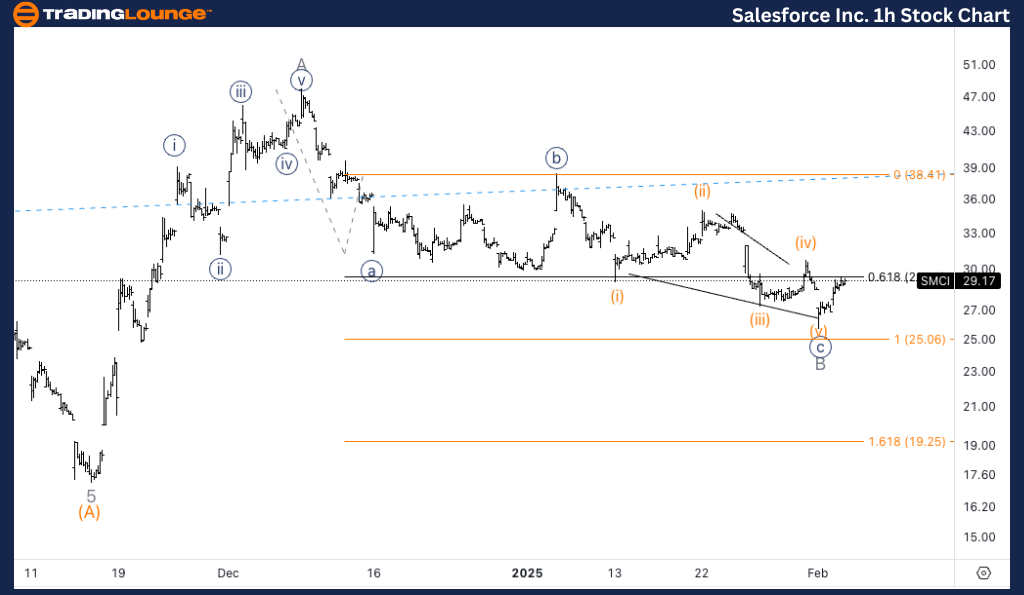
SMCI Elliott Wave technical analysis
Function: Counter Trend.
Mode: Corrective.
Structure: Zigzag.
Position: Wave i of C.
Direction: Upside into wave i.
Details: Looking at a potential bottom in place in wave c of B after an ending diagonal. We fell just short of equality of c vs. a suggesting a bottom could be in place or soon to be.
SMCI Elliott Wave technical analysis – One-hour chart
On the 1-hour chart, SMCI has likely formed a bottom in wave c of B, suggesting the start of an upward move in wave i of C. The stock has fallen just short of wave equality, indicating a potential reversal. If momentum builds, we could see a strong retracement, but traders should remain cautious of resistance levels and possible reversals. Watching for volume and breakout confirmations will be key to assessing the strength of the current move.
This analysis focuses on the current trend structure of Salesforce Inc., (SMCI) utilizing the Elliott Wave Theory on both the daily and 1-hour charts. Below is a breakdown of the stock’s position and potential future movements.
Salesforce Inc. (SMCI) Elliott Wave technical analysis [Video]


")

